regression incoming.

quant nfl fantasy model. built by someone who still ignores it.

2026 preseason rankings for 412 players. 99-feature model, confidence scores, injury-return pathway, college-to-pro rookie projections.


what's inside

99-feature XGBoost
rolling stats, position-specific Elo matchup ratings, vegas lines, coaching tendencies, age curves, depth chart opportunity. trained on 2018–2025.
injury-return pathway
58 players returning from injury or IR. performance decay/recovery curve calibrated on historical return-game data. confidence tiers reflect recovery uncertainty.
college-to-pro rookies
two-stage model: draft capital (pre-draft) + landing-spot context (depth chart, target share, backfield role). conference-adjusted college production metrics.
confidence scores
every player row has a 0–1 confidence score. veterans with full historical signal score near 1.0. rookies and IR returns score lower. honest uncertainty, not false precision.

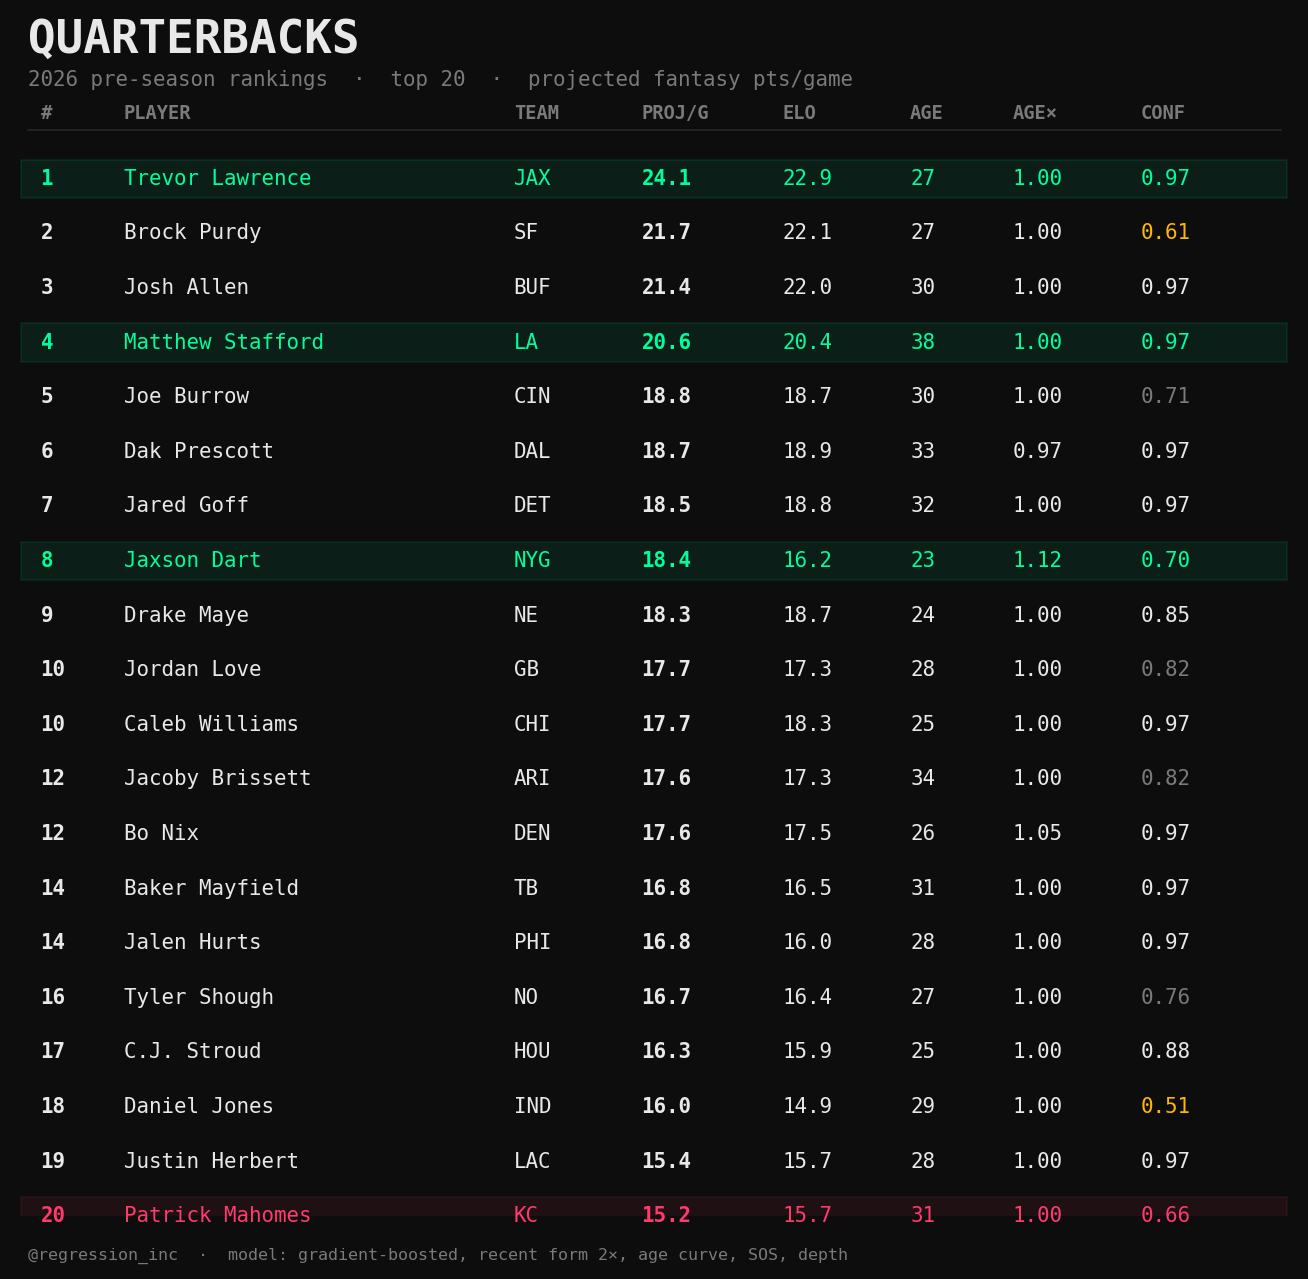
2026 QB rankings (model output)

2026 NFL QB preseason fantasy rankings — regression incoming model

412 players ranked. updated weekly through training camp. data version: 2026-06-08. full rankings + commentary →


latest analysis

2026 fantasy draft strategy: the model ran the numbers so we didn't have to argue about it

2026 fantasy draft strategy: the model ran the numbers so we didn't have to argue about it

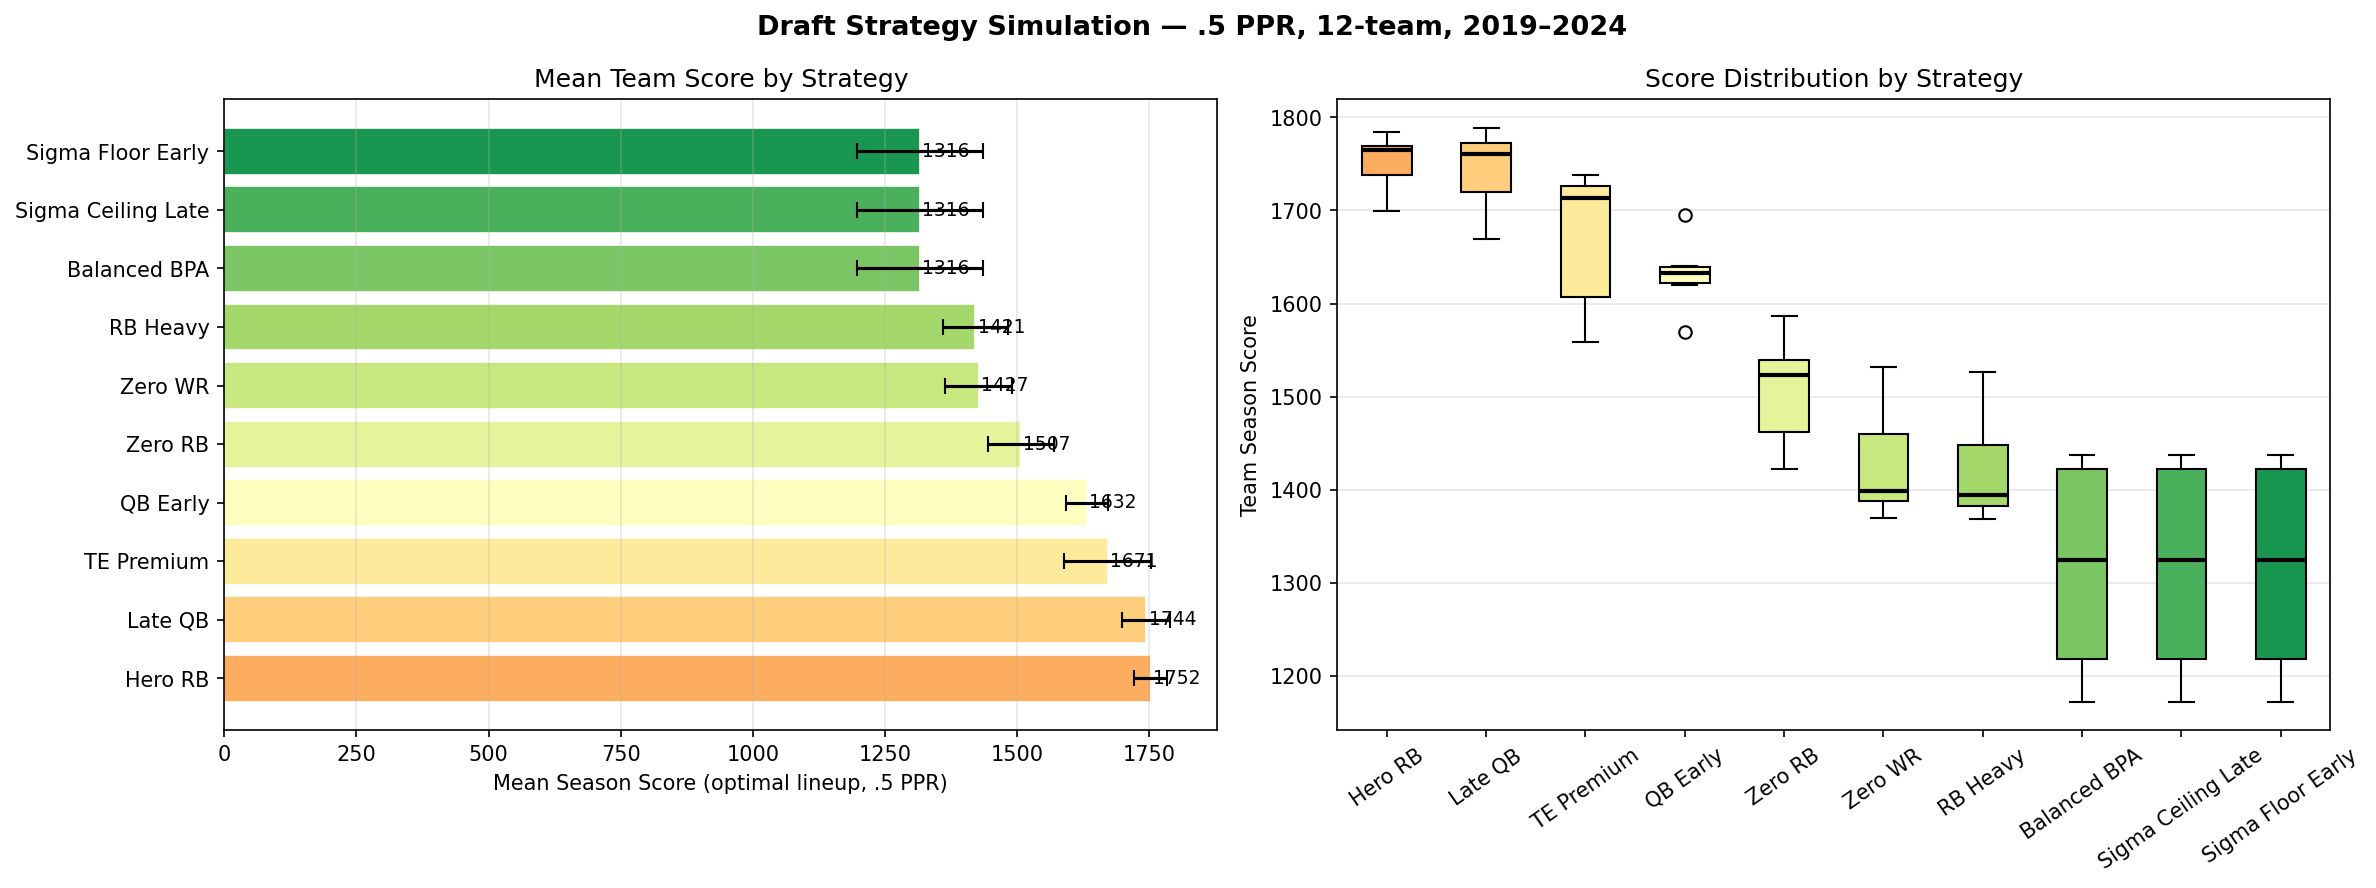
zero-RB, robust-RB, elite-TE, BPA: the model backtested six draft strategies across six seasons. one of them wins. the others produce second-place finishes with good vibes.

2026 rookie draft guide: vor, adp, and who the model actually trusts

2026 rookie draft guide: vor, adp, and who the model actually trusts

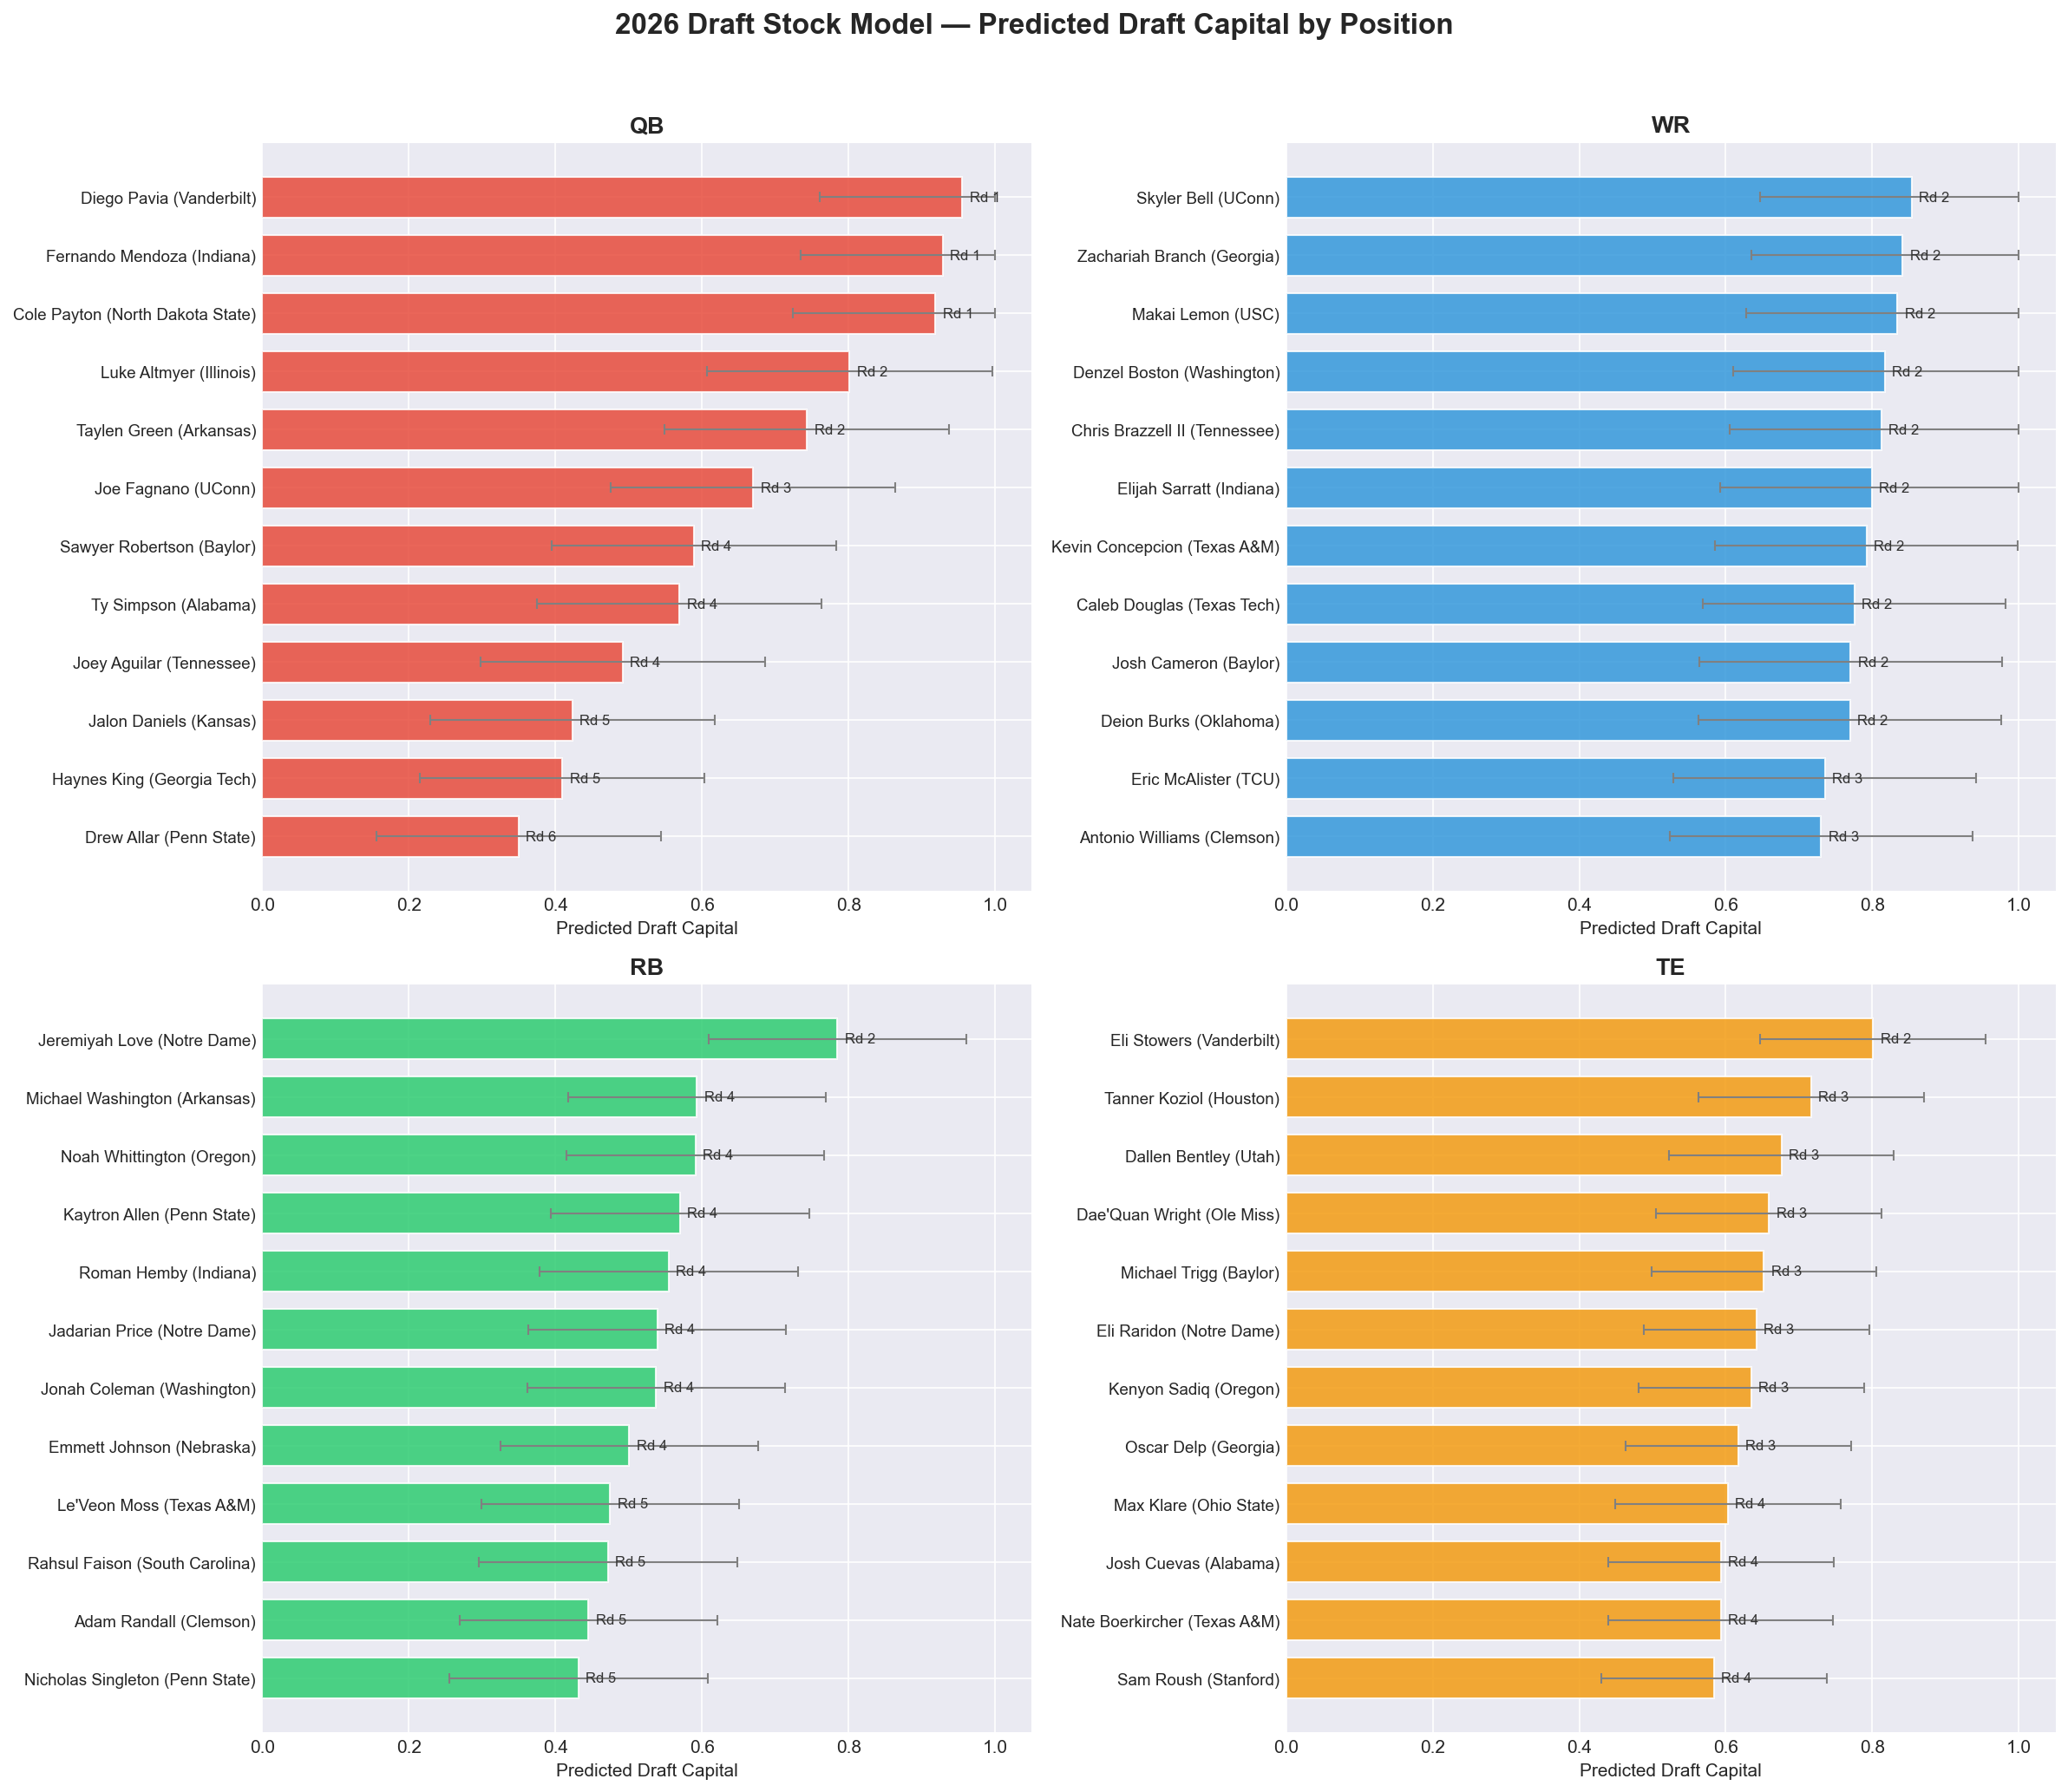
not every year-1 breakout candidate is real. the model ran 2026 rookies through a two-stage projection: draft capital, then landing-spot-adjusted fantasy points. here's who has signal and who has hype.

DST rankings 2026: what the model says, where the market is wrong, and why it matters

DST rankings 2026: what the model says, where the market is wrong, and why it matters

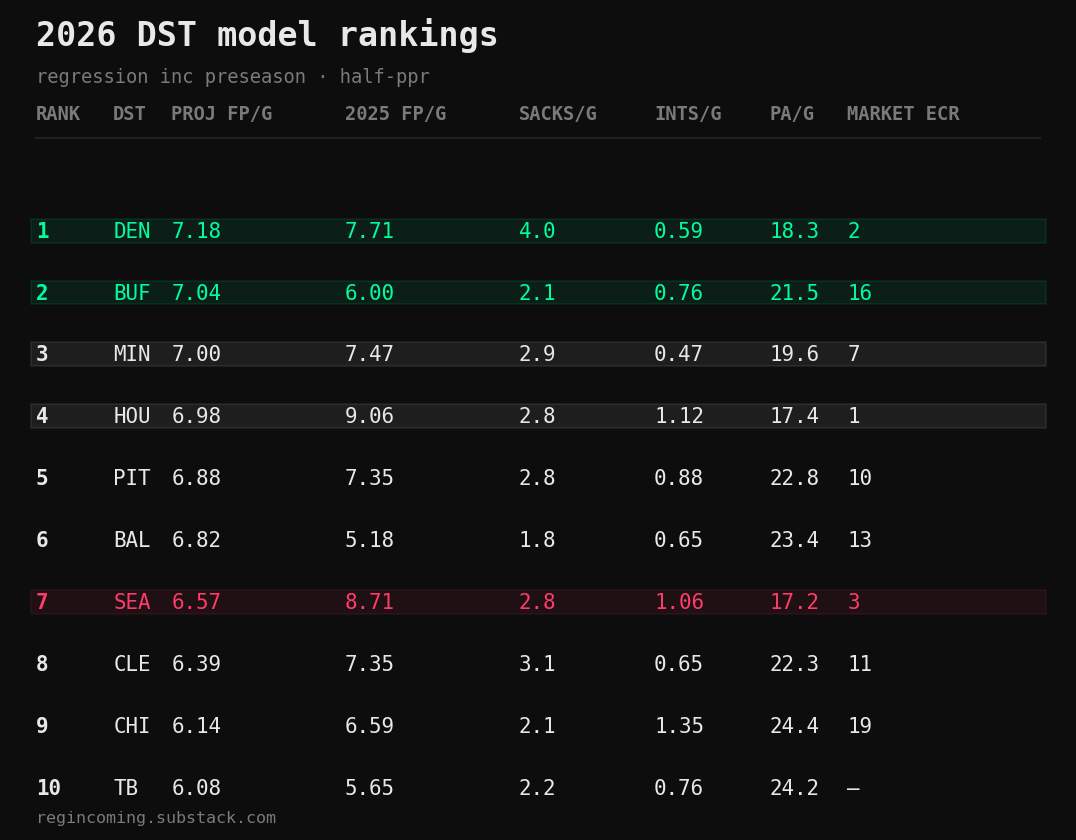
DST year-over-year correlation is 0.31. the market prices DSTs like it's 0.80. the model exploits that gap. SOS, coaching continuity, and turnover rate drive the rankings.

all articles →


get the data

$3 — draft week bundle
one payment. 7-day unlimited access to all 412-player rankings, full CSV download, draft board, confidence scores, and injury-return flags. buy thursday, use all weekend. no subscription, no account required. see pricing →
free taste-test: top 1 per position, no wallet needed.  ·  building an agent? api docs + x402 manifest.