2026 pre-season pre-draft positional rankings: full model release (free)
full model release for 2026 preseason: 412 players (QB/RB/WR/TE), confidence scores, injury-return pathway, rookie projections. the hot takes the model is forcing us to say out loud.
originally published on substack
2026 pre-season pre-draft positional rankings: full model release (free)
[📥 Download the full Google Sheet here. placeholder link]
we built this model because vibes were losing us leagues.
not metaphorically. literally sitting in draft rooms in 2024 taking guys because they "just look like a RB1" while our model had them at 8.3 projected points per game and a 0.51 confidence score. that is on us. this is the correction.
today we're releasing the full 2026 pre-season positional rankings: QB, RB, WR, TE. completely free. no paywall, no teaser, no "DM for the full sheet." everything is here.
what the model actually does (and what it can't)
the core model outputs a raw fantasy point projection per game based on recent production signals. we then apply three adjustments: an age curve multiplier (youth gets boosted, age cliffs get penalized: the cliff hits hard around 32-33 for most positions), a strength of schedule rating (opponent defensive quality adjusts projected output up or down), and a depth rank penalty (depth 2+ players get a haircut regardless of raw talent).
we track a confidence score (0–1) that reflects sample size stability. a guy with 0.33 confidence means the model barely has enough signal to trust the number. treat it as a range, not a point estimate. anything above 0.85 we feel good about.
what it cannot do: predict injuries. account for preseason trades it doesn't know about yet. beat weekly variance. nobody does. we're trying to be right on average over a season, not right every sunday.
raw model outputs are what we call the "Elo signal": the model's base read before contextual adjustments. the final projected pts/game is what you should actually care about for drafts.
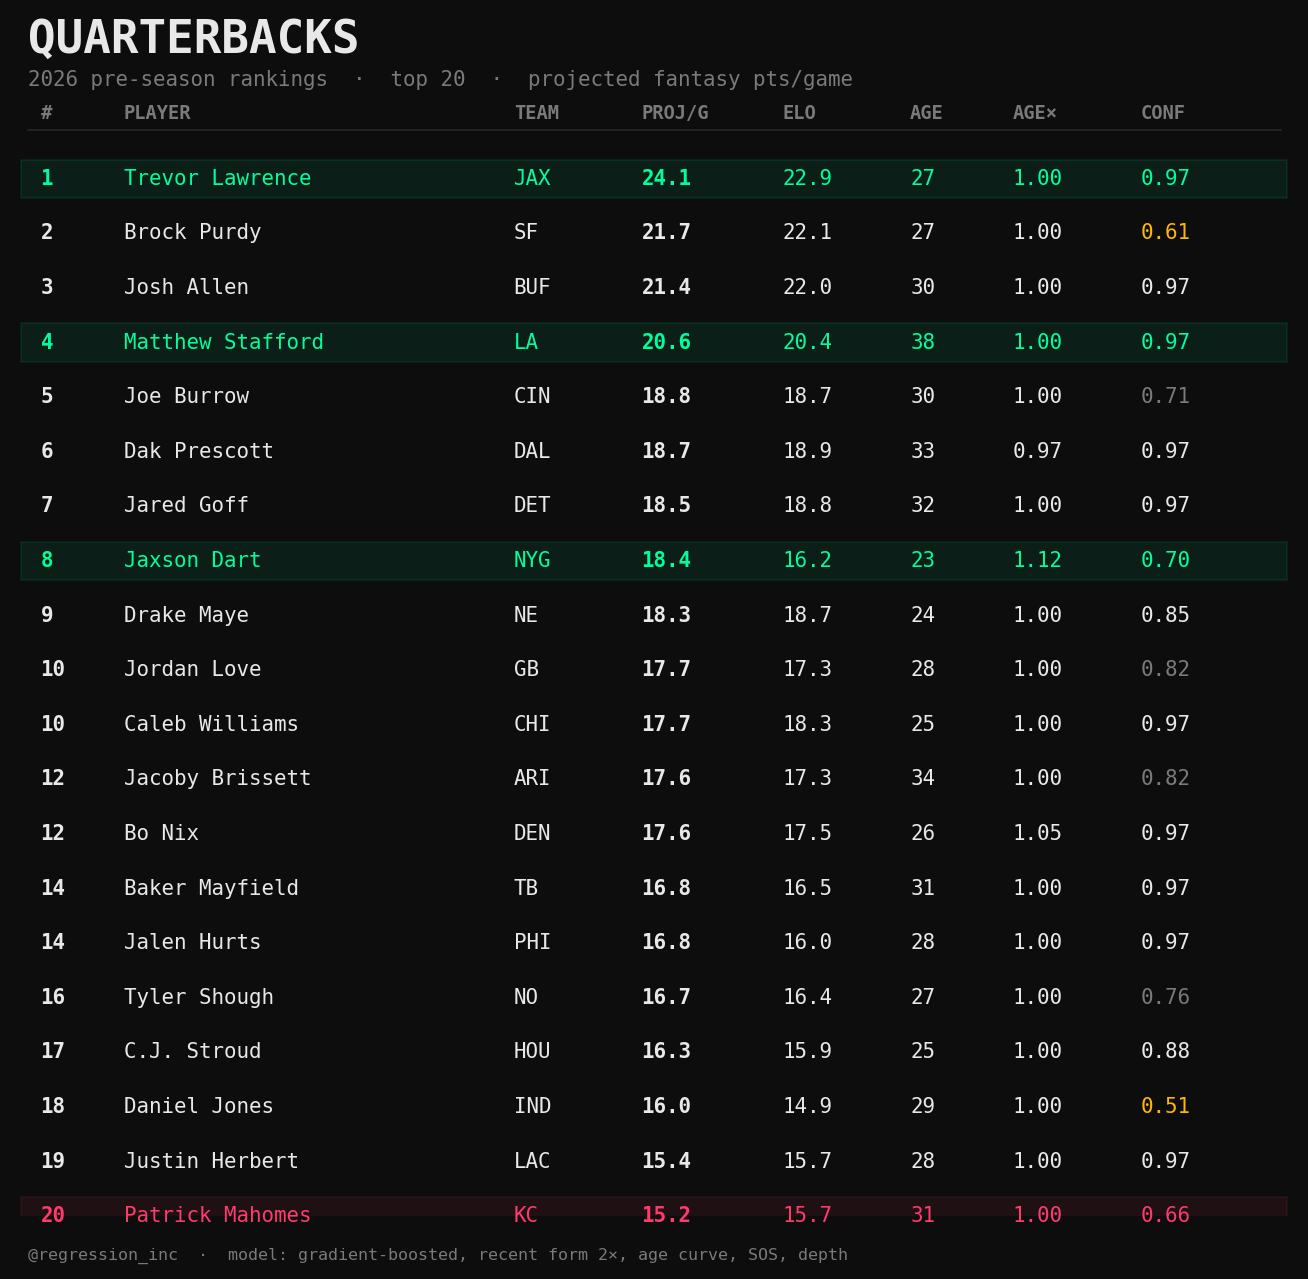
quarterback rankings: top 20
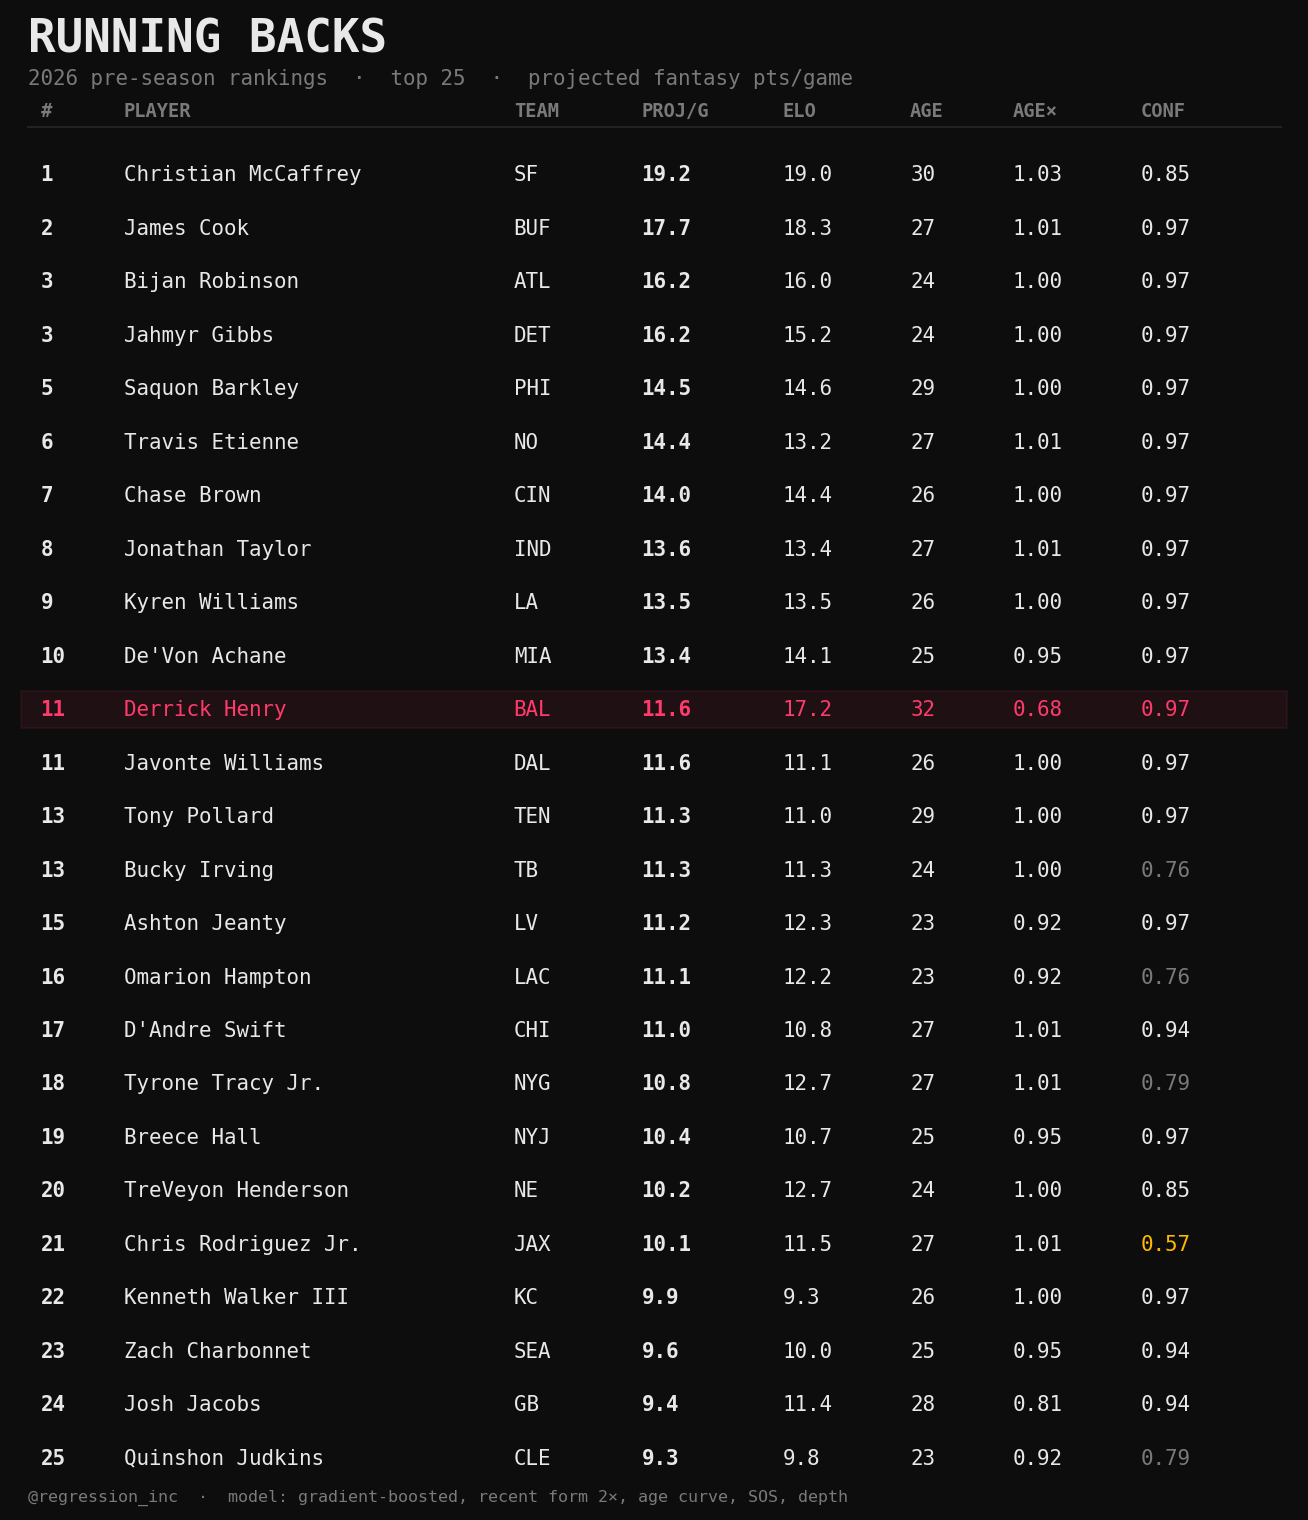
running back rankings: top 25
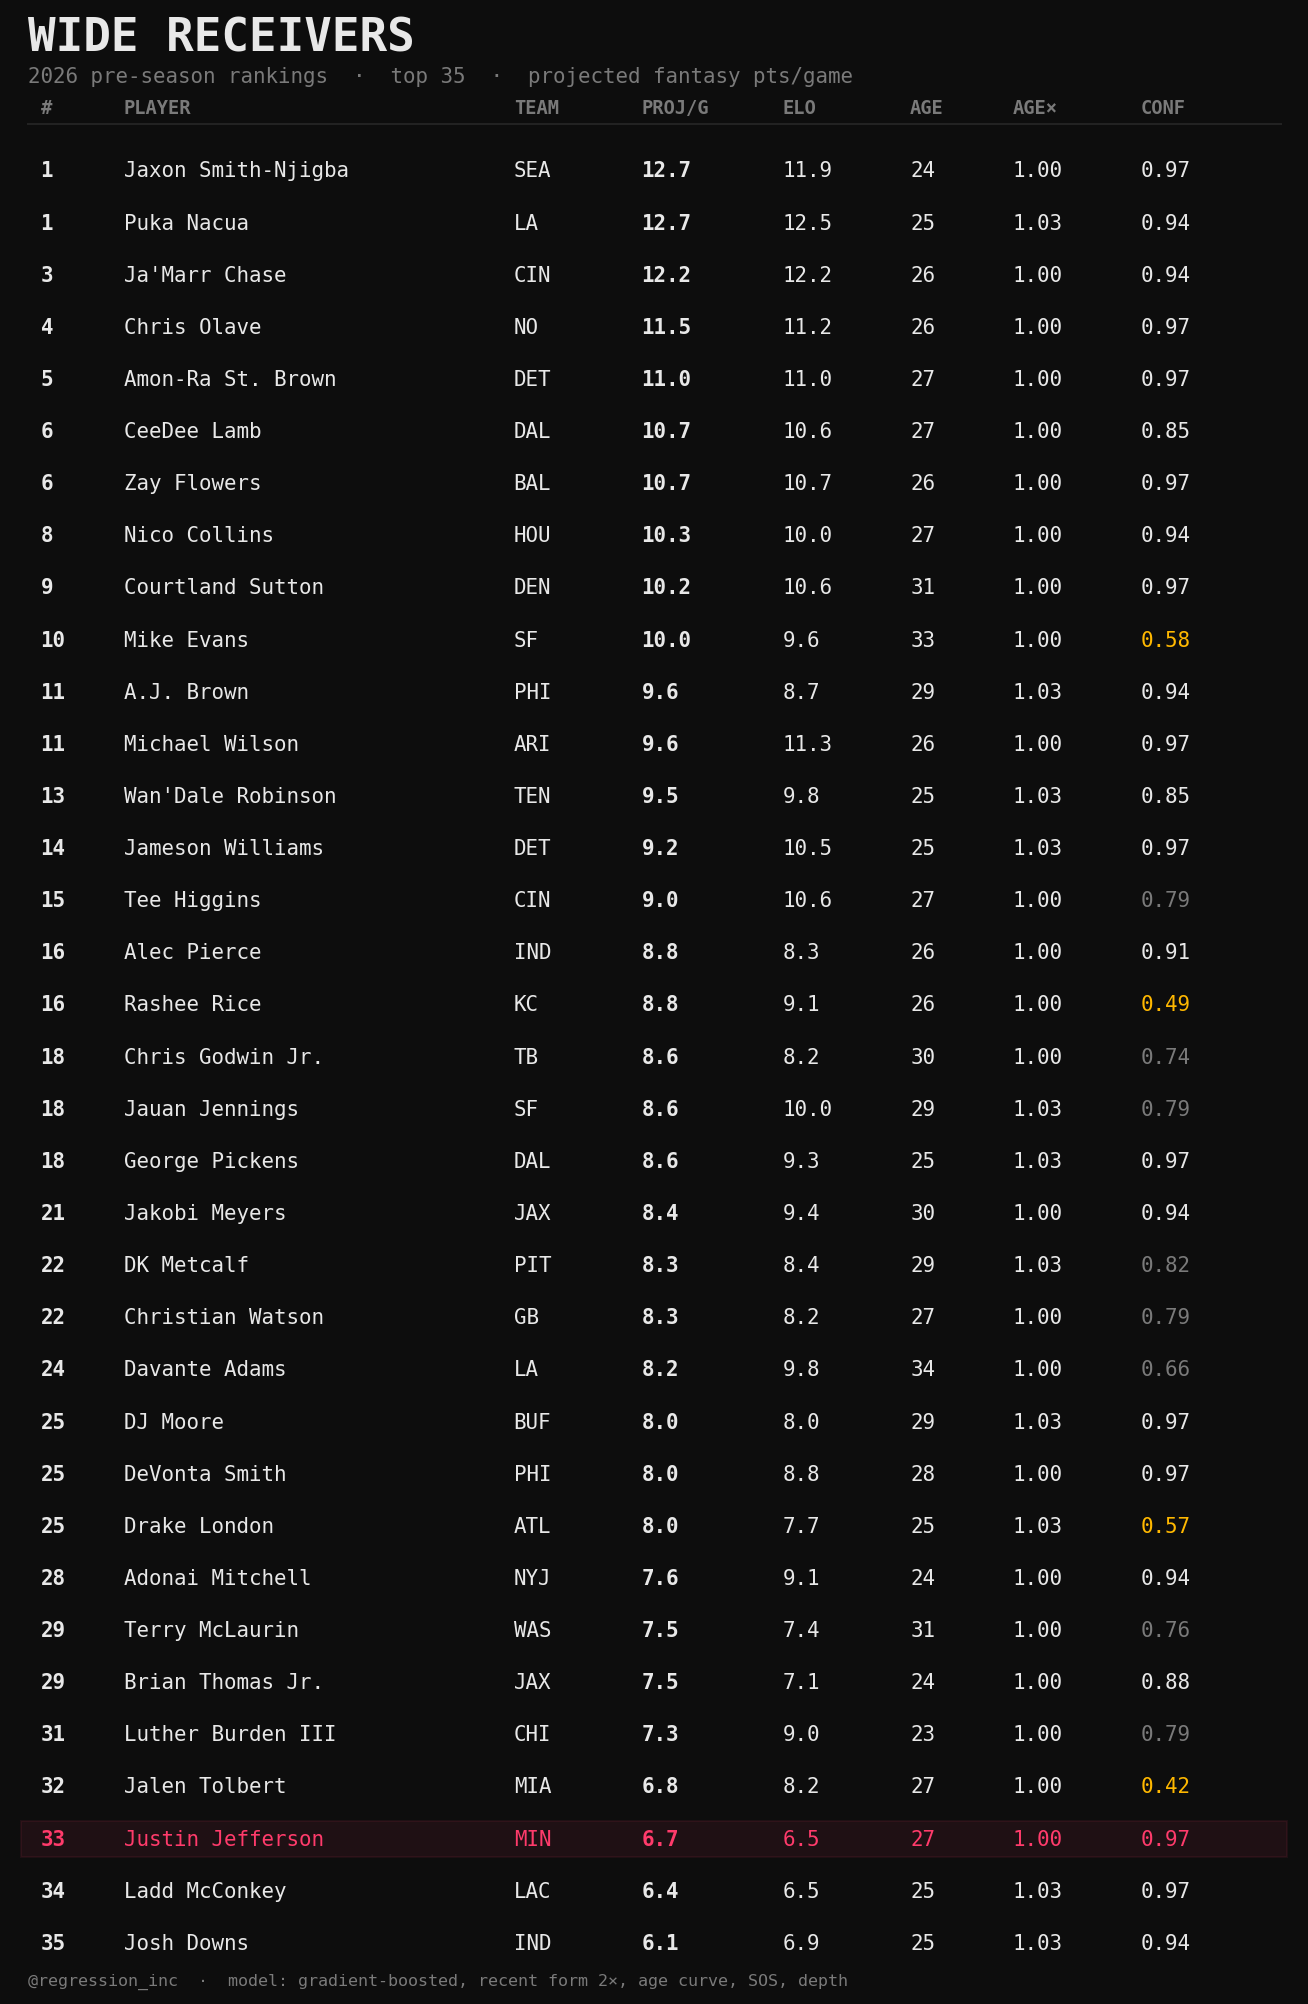
wide receiver rankings: top 35
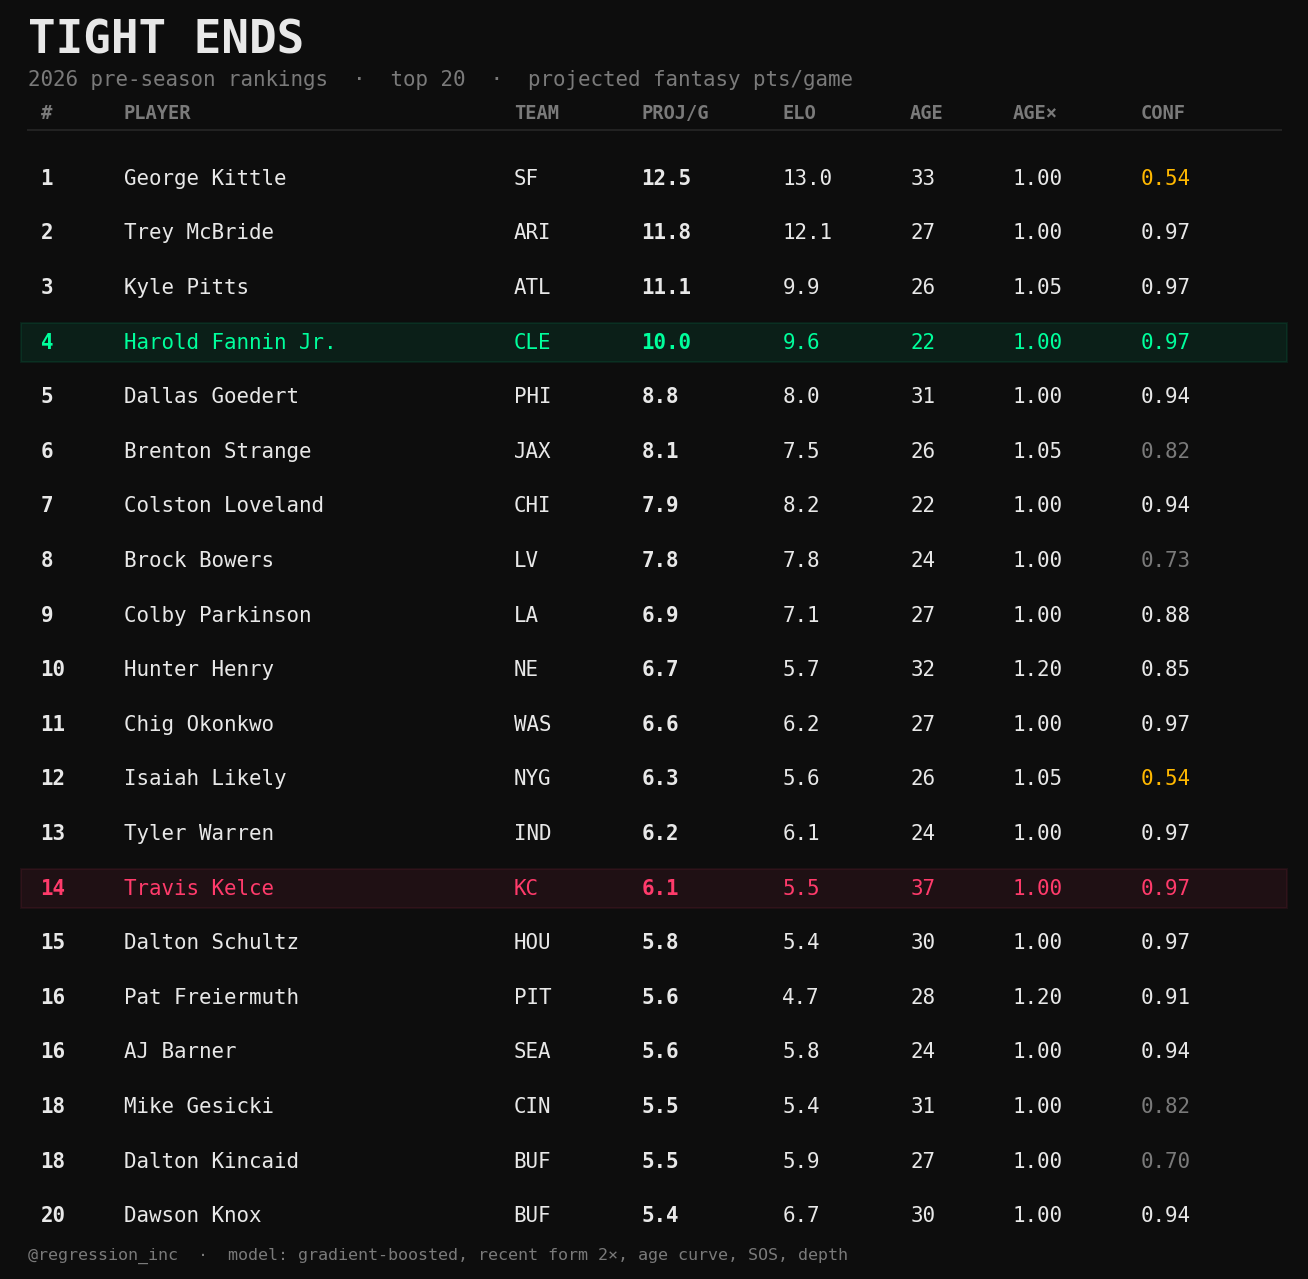
tight end rankings: top 20
the hot takes the model is forcing us to say out loud
1. patrick mahomes is a QB20.
15.2 projected points per game. confidence score of 0.66. only 14 games in the sample.
this isn't an indictment of mahomes as a football player. the model is signaling genuine uncertainty about role, health, and sample size. the confidence score reflects that we can't build a clean projection here. in fantasy terms: you are being priced as if you're picking a top-3 QB. the model says you're picking a coin flip at 15 points per game. that's a material difference.
2. lamar jackson at QB24.
13.7 projected points per game. one of the most physically dominant players in the league, and the model has him 23 spots below trevor lawrence.
here's the math: only 12 games in the signal window, 0.73 confidence, and the elo base (13.7) isn't being boosted by anything. the SOS is roughly neutral. the age curve is flat. this is the model saying "his recent production doesn't support a top-10 fantasy projection." argue with it in the comments. we welcome it.
3. jaxson dart is a top-10 QB.
18.4 projected points per game. 0.70 confidence. the age multiplier of 1.12 is doing real work here: the model is rewarding young QBs with legitimate Elo signals.
we want to be honest: the confidence is 0.70 on 11 games of sample. this is a range estimate, not a lock. but the raw signal (16.2) is not a fluke, and the NYG situation has enough volume to be interesting in fantasy.
4. justin jefferson is WR33.
6.7 projected points per game. full 16-game schedule projection. 0.97 confidence.
this is the model being honest about a production season that didn't match the hype. jefferson's raw elo signal is 6.5. there's no SOS adjustment or depth penalty. the model just read the tape and said "this guy's been a WR2 recently." if you're drafting him at WR5 on reputation, you're paying 2023 prices for 2025 production. we're not doing it.
5. marvin harrison jr. is WR63.
3.8 projected points per game. 0.60 confidence. only 12 games in the sample.
year 2 breakout candidates are real. the model doesn't have enough signal yet. low confidence means high variance: he could finish WR20 or WR80. bet accordingly. or don't. we're not your dad.
6. derrick henry's age cliff arrives.
raw elo signal: 17.2. which would make him RB2 on raw production alone. after the age multiplier of 0.675, he lands at 11.6 projected pts/game and RB11.
the model respects what henry did in 2024. the age curve does not care. RB11 on a 32-year-old workhorse is genuinely useful: just don't pay RB4 prices for him.
7. harold fannin jr. is TE4 as a rookie.
10.0 projected points per game. 0.97 confidence. age 22.
this is the model finding usage signal in the CLE system and rewarding a full-season projection. if you're in a TE-premium league, the implied ADP vs. model value gap here is going to be enormous early in the season.
8. travis kelce is TE14.
6.1 projected points per game. 37 years old. 0.97 confidence means we're sure about the decline. the model isn't uncertain, it's just done apologizing for the number.
how the model works (quick methodology)
the base elo signal is a gradient-boosted model trained on NFL weekly stats going back to 2018. features include: target share, snap percentage, yards per route run, red zone usage, air yards, and opponent defensive quality by position. recent weeks are weighted 2x versus games from earlier in the season to capture current form.
age adjustments are non-linear. for most positions the peak is 24–28. the curve is gentle until ~31, then steeper. the multipliers you see in the tables are the actual factors applied: 1.12 for 23-year-old QBs, 0.675 for 32-year-old RBs. yes this means your 32-year-old league-winner from last year is cooked on paper. the curve doesn't negotiate. derrick henry is exhibit A.
confidence scores are built from sample size, signal variance, and game-count reliability. anything below 0.65 should be treated as a range, not a point estimate.
what we're still improving: we don't have pre-draft landing spot data integrated yet. once the draft resolves, we'll re-run every rookie through the model with real situation context. that update is coming before week 1.
what's next
- post-draft model refresh with landing spot adjustments for all 2026 rookies
- individual position deep-dives (we have thoughts on the QB1 situation that the table doesn't fully capture)
- player comps: which 2026 players have the closest career trajectories to historical breakouts
- weekly in-season projections starting in august
come fight us in the comments with the ranking you most violently disagree with. we log every W and L in january.
follow for all of the above. it's free until it isn't.
[📥 Download the full Google Sheet here. placeholder link]