DST rankings 2026: what the model says, where the market is wrong, and why it matters
DST year-over-year correlation is 0.31. the market prices DSTs like it's 0.80. the model exploits that gap. SOS, coaching continuity, and turnover rate drive the rankings.
originally published on substack
DST rankings 2026: what the model says, where the market is wrong, and why it matters
regression incoming | 2026 preseason
[grab the full preseason rankings sheet here: https://tinyurl.com/regincoming2026preseason]
DST is the position that ruins more fantasy seasons than any other, not because people draft it wrong, but because they manage it wrong afterward. they hold onto last year's elite unit through a brutal four-game stretch when they should be streaming. they stream a garbage unit against a weak offense and watch it give up 35.
the underlying problem is the same: people don't have a model for how DST output is actually generated. they have a vibe.
we got tired of losing to the vibe. this is what the model says about 2026.
how predictive is DST year over year?
this is the honest starting point. DST fantasy output is not strongly predictable year-over-year from the previous year's fantasy points alone. the correlation is positive but weak, which is exactly what you'd expect from a position where schedule, opponent quality, and game script all matter heavily.
what does persist:
- sack rate: teams that generate pressure consistently maintain that across seasons with similar personnel
- turnover rate: INT and fumble rates regress more than sack rates, but teams with plus schemes and personnel tend to cluster above average
- points allowed: largely driven by opposing offense quality. the best forward-looking signal isn't last year's PA number, it's what offenses your unit is likely to face in 2026
that last point is why the model disagrees with the market in some significant places. the market is too sticky on 2025 fantasy results. the model asks: who are they playing?
what the model weights
the primary inputs:
- 2025 DST fantasy points per game: baseline performance, weighted for recency (last 4 and last 6 games get extra weight as they reflect current unit quality)
- sacks per game: the most persistent play-making metric
- interceptions per game: turnover creation, regressed forward
- fumbles forced per game: supplementary turnover signal
- defensive touchdowns: small but real contribution
- points allowed per game: historical scoring allowed, which informs PA scoring bracket
- 2026 opponent implied totals: how difficult is the schedule? what offenses are they facing?
- opposing offense EPA: a quality-adjusted measure of the offenses this unit will face
the model is not guessing about schedule quality. it's computing the 2026 average opponent total and using it as a forward-looking adjustment.
the 2026 top 10
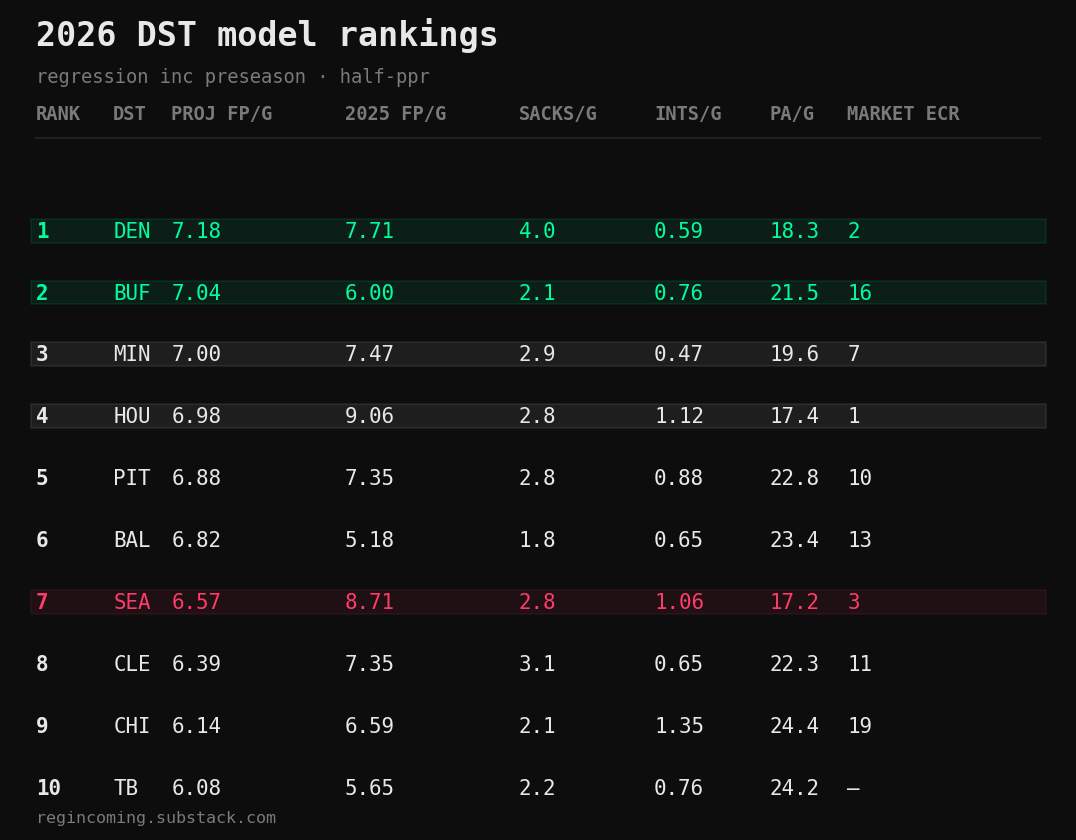
Denver Broncos (d1, 7.18 FP/G projected)
the model's top DST. Denver led the model in sack rate (4.0 per game in 2025), held opponents to 18.3 points per game, and faces a 2026 schedule with an average opponent implied total of 44.5. the opposing offense EPA was -0.10, meaning they faced below-average offenses in 2025, and the 2026 schedule looks similar.
the market has them at d2, so there's no major steal here. but the model's conviction is high enough that we'd push Denver into any conversation about the top overall DST. take them if they're available at d2 on your board.
Buffalo Bills (d2, 7.04 FP/G projected) - market d16
this is the model's biggest DST sleeper and the sharpest disagreement with the market in the entire rankings set. the market has Buffalo at d16. our model has them at d2.
here's the case. Buffalo's 2025 output (6.0 FP/G) was decent but not elite, which is why the market is skeptical. the model looks past the headline number to the underlying unit: 2.12 sacks/game (consistent pressure), 0.76 INT/game (above-average turnover creation), and 21.5 points allowed per game (solid but not spectacular). the opp_off_epa was -0.02, essentially neutral, meaning the schedule neither helped nor hurt them.
what the market may be missing: Buffalo's defense underperformed its underlying metrics in 2025. the unit is intact, the scheme is established, and the 2026 schedule (avg opponent total 47.8) is tougher than DEN or MIN but not prohibitively so. the model projects top-2 output. if you can get Buffalo in round 3-4 of DST selections while the market sleeps on them, that's a genuine advantage.
Minnesota Vikings (d3, 7.00 FP/G projected) - market d7
Minnesota closed 2025 strong: 11.25 FP/G over the final four weeks. the full-season number (7.47) already reflects a quality defense, and the 2026 schedule is one of the softer in the model (avg opponent total 44.4, opp_off_epa -0.12). the market has them d7, which reflects some discount for the schedule or uncertainty around the unit.
the model sees a top-3 unit with a soft schedule. if MIN is available at market price (d7) while you're targeting d3 value, it's a straightforward decision. take them.
Houston Texans (d4, 6.98 FP/G projected) - market d1
the market loves HOU DST and honestly it's not wrong to. they allowed 17.4 points per game in 2025, the best mark in the league. they generated 1.12 interceptions per game, which is elite. the 2026 schedule (avg opponent total 44.8) is moderate. opp_off_epa of -0.14 means they faced below-average offenses in 2025 and should face similar quality in 2026.
so why are they model d4 instead of d1? two reasons:
- the model applies regression to extreme PA numbers. 17.4 PA is genuinely great but it's at the edge of what's sustainable over 17 games
- the underlying sack rate (2.76/g) is solid but not exceptional
the market paying d1 price reflects the 2025 result heavily. the model says they're still elite but probably deliver d3-d5 output rather than d1. this is a mild fade, not a hard one. we'd still draft them comfortably.
Pittsburgh Steelers (d5, 6.88 FP/G projected) - market d10
Pittsburgh's sack rate (2.82/g) and consistent defensive identity make them a reliable projection. the 2026 schedule is soft (avg opponent total 43.9, lowest among the top 10 DSTs). the market has them d10, which represents real value. a unit projecting d5 output available at d10 is a draft-day win.
Baltimore Ravens (d6, 6.82 FP/G projected) - market d13
the model values Baltimore more than the market does. their 2025 output was lower (5.18 FP/G) but the model sees their underlying quality (consistent pressure, established scheme) and projects recovery. the 2026 schedule (avg opponent total 48.75) is one of the tougher ones in these rankings, which is a real headwind. at d13 on the market, the model sees value even accounting for the schedule.
Cleveland Browns (d8, 6.39 FP/G projected)
Cleveland's sack rate (3.12/g) is among the highest in the model. PA is average but the schedule (avg opponent total 40.25) is the softest in the model, which is a significant tailwind. at d11 on the market, there's value. a schedule-boosted unit with real underlying pressure.
the market mistakes
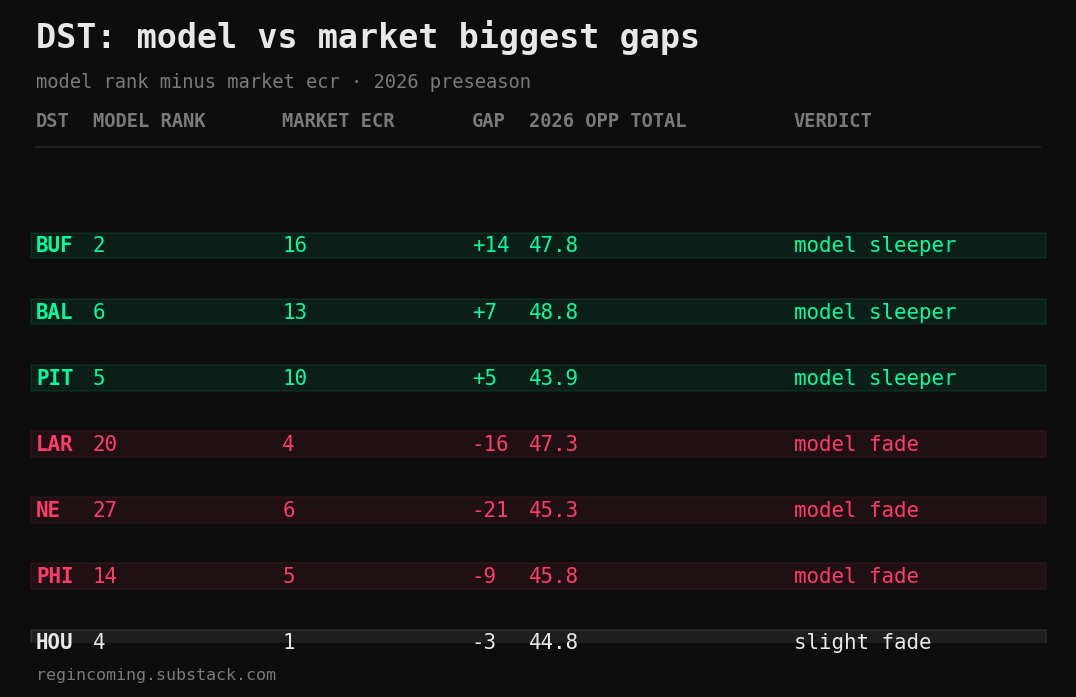
Los Angeles Rams (model d20, market d4)
the clearest overvaluation in the DST rankings. the Rams had a genuinely good 2025 season (7.41 FP/G). the market saw it, priced them d4, and called it a day. the model sees a 2026 schedule where the avg opponent implied total is 47.3, which is harder than what they faced in 2025, and no obvious unit upgrade to offset it. sacks (2.76/g) and turnovers (0.94 INT/g) are solid but not elite.
the model projects 5.71 FP/G, down from 7.41. that's a meaningful regression call. drafting LA DST d4 means you're paying top-4 price for a unit the model sees as d20. we'd pass and take Denver or Buffalo.
New England Patriots (model d27, market d6)
the sharpest fade in the model. the market is enamored with New England's 2025 PA number: 18.8 points allowed per game is elite. the model sees what's underneath: 2.06 sacks per game (below average) and 0.59 interceptions per game (below average). the PA result looks like schedule and opponent quality, not unit dominance. the model doesn't believe NE can repeat that PA performance with a below-average sack and turnover profile.
projection: 4.71 FP/G at model d27. the market is giving them d6. we'd take almost any of the model's top-10 over NE at the same board position.
Philadelphia Eagles (model d14, market d5)
Philadelphia is a legitimately good unit, which makes this less of a hard fade and more of a price discrepancy. the model has them d14, the market d5. PHI's schedule (avg opponent total 45.8) is average, the opp_off_epa is -0.09 (slightly favorable), and their underlying metrics are solid. the issue is the market premium. at d5, you're paying for d1-d5 output, and the model projects d14. the expected value isn't there.
Seattle Seahawks (model d7, market d3)
SEA was genuinely good in 2025 (8.71 FP/G). the market is extrapolating that forward at d3. the model projects d7 output (6.57 FP/G), which is still quality, just not d3 quality. if you're drafting the market's d3 and getting the model's d7, you've left value on the board.
the dallas recovery bet
DAL DST sits at model d11, projecting 6.06 FP/G. their 2025 output was 2.59 FP/G, the worst in the league. the model is projecting a recovery toward their underlying defensive quality rather than extrapolating the disaster. whether you believe in that recovery depends on whether you think 2025 was a genuine unit collapse or a scheduling and execution anomaly.
the headwind is real: avg opponent total 49.92, the hardest 2026 schedule in the model. opp_off_epa of 0.16 means they're facing quality offenses. we'd treat them as a high-variance streaming option rather than a draft-day target.
how to draft DSTs in 2026
tier 1 (draft in rounds 1-2 of DST selection, whatever that means on your board)
Denver, Buffalo, Minnesota, Houston
the model has high conviction on all four. Buffalo at market d16 is the steal of the group. take Denver and BUF ahead of market and pocket the value.
tier 2 (quality starts, some market value)
Pittsburgh, Baltimore, Cleveland
PIT at market d10 is real value for a model d5. CLE benefits from schedule. BAL is projecting recovery.
tier 3 (solid if priced right)
Chicago, Tampa Bay, LAC, Jacksonville
each has a reason they're there (CHI's turnover rate, JAX's 2025 finish) but each also has a reason they're not higher. stream confidently, don't overpay in draft.
market traps to avoid at market price
New England (model d27), Los Angeles Rams (model d20), Philadelphia (model d14)
none of these are bad units. all three are bad values at what the market is charging for them.
the DST market is inefficient because the position is hard to evaluate and most people lean on last year's scoring results. that's where the model wins. take the units with sustainable underlying metrics and favorable schedules. let the market chase last year's headlines.
[grab the full preseason rankings sheet here: https://tinyurl.com/regincoming2026preseason]