the injury return problem (and what the data actually says)
58 players are returning from significant injury in 2026. the standard model misprices all of them. the injury-return pathway adds confidence tiers, recovery factors, and honest uncertainty to each projection.
originally published on substack
the injury return problem (and what the data actually says)
[📥 Download the full Google Sheet here: [sheet link]]
we shipped the preseason rankings in May with a quiet flaw.
any player who got hurt before week 14 of the 2025 season didn't exist in the model. not ranked low. not flagged. not discounted. absent. and we'd been assigning every single one of them the same confidence score of 0.30 when we tried to project their return.
Malik Nabers had 94 targets in 2024. finished as a borderline WR1 as a rookie. then a concussion in week 5 of 2025. then an ACL later that season. by our model's logic: no late-season data window, no row, no rank. and when we did project his return, the model was reading the first injury on record, not the worst. that meant the concussion: 0.38 confidence, 0.90x recovery, WR4 at 11.8 fp/g. the season-ending injury was the ACL. the model was wrong.
both of those are now fixed. but the more interesting part is what happened after we fixed them.
why the model couldn't see them
the production model uses the final four weeks of the prior season (weeks 14-17) as the feature snapshot for each player. that window is where it reads form: target share, snap rate, yards per route, red zone usage, expected points added. if a player stopped playing before week 14, that window is empty. the model doesn't project a zero. it doesn't project anything. the player is silently dropped.
this works fine for the vast majority of players. it fails specifically for players who had a meaningful injury early in 2025 and simply didn't accumulate late-season data. Nabers is the clearest case, but he wasn't alone. we identified 58 players who were healthy in 2024 (10+ games) but absent from the late-2025 window.
how the injury return pathway works
the fix looks back one additional season. for any player missing from the current late-season snapshot who had at least 10 games in their prior healthy season (2024), the model:
- takes their 2024 late-season feature state (the last four weeks of 2024)
- scores it through the same production XGBoost
- applies an injury-type recovery factor based on what the injury actually was
- applies all standard offseason adjustments: age curve, team change, depth chart, SOS, contract signal
- stamps it as
data_source = injury_returnfor transparency
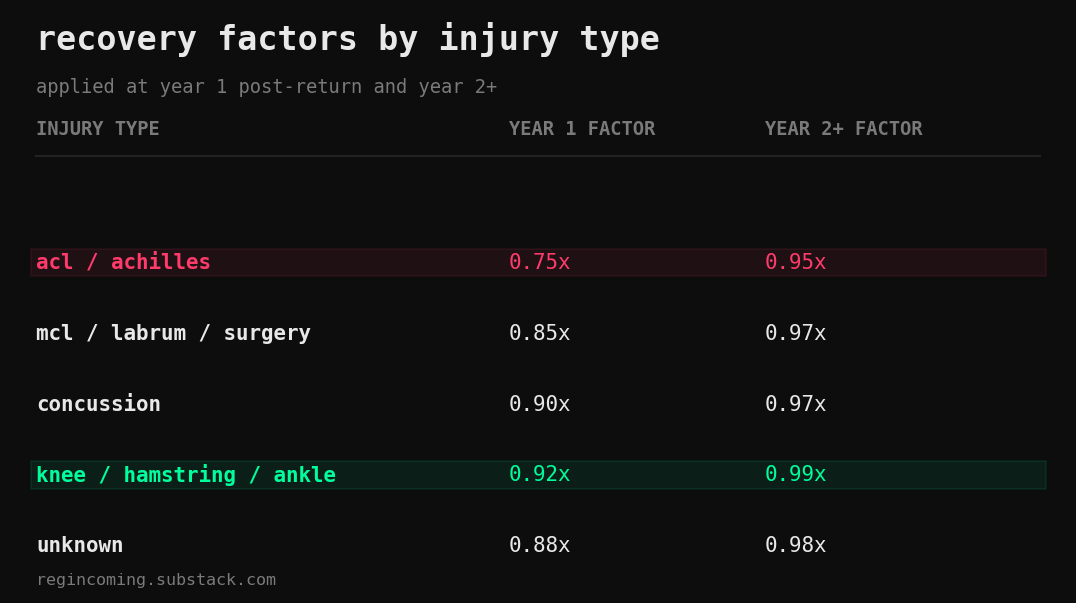
for Nabers: ACL in 2025 is the worst injury on record. 0.75x recovery factor. his 2024 late-season features projected through XGBoost, discounted 25%. WR16 at 9.2 fp/g.
where 0.30 came from, and the two ways it was wrong
the original pathway had two distinct bugs.
bug 1: flat confidence. every IR player got 0.30. the logic was roughly "we're using 2-year-old data, that's worse than current data, so confidence should be low-ish." not wrong. but it was the same number for a knee returner and an ACL returner, which is clearly not right if you spend five seconds thinking about it.
bug 2: earliest injury, not worst. when a player had multiple injuries logged, the model used the first one on record. for Nabers: concussion in week 5 came first. ACL came later. the model was projecting him at 0.38 concussion confidence when the dominant injury was the ACL.
so we ran the backtest.
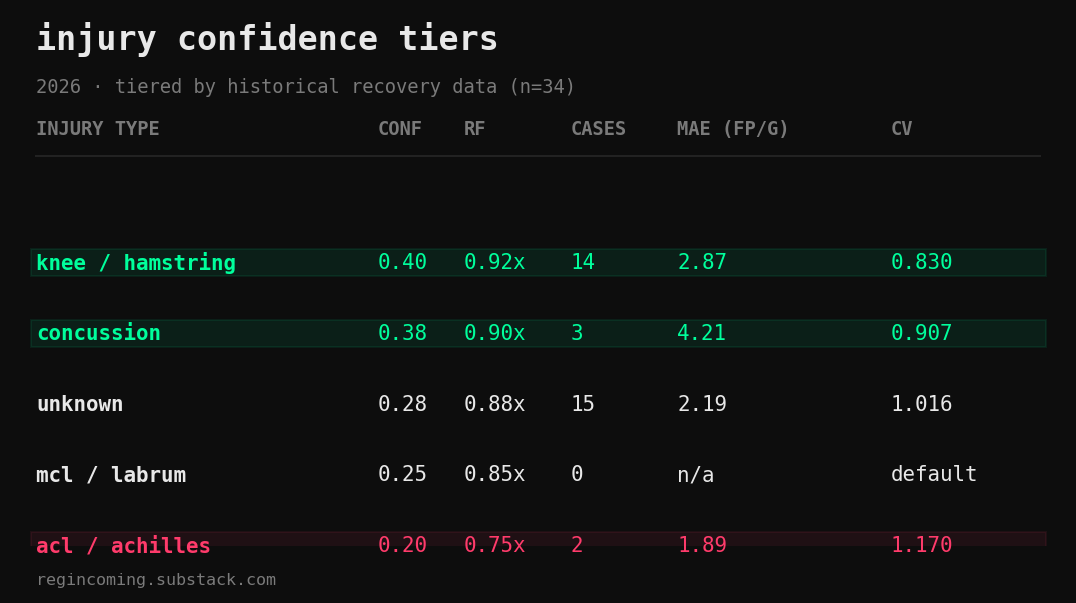
methodology: we pulled 34 historical return cases. players who had 10+ games in year T-2 (healthy baseline), fewer than 4 games in year T-1 (missed season), and came back in year T. ran the IR pathway on each (T-2 features x recovery factor), compared to actual T performance. grouped by injury tier. calculated the coefficient of variation (CV = std / mean of absolute error) per tier. lower CV = more consistent errors = higher confidence.
the flat 0.30 was wrong in two directions.
too pessimistic for most IR players. knee and hamstring returnees had a CV of 0.830, the most consistent error distribution of any tier. when a player comes back from a knee or hamstring injury, the model can at least put reasonable bounds on where they'll land. they deserve 0.40, not 0.30.
too pessimistic for concussion returners specifically. the historical cases show concussion recovery is fairly complete. when a skill player returns from a concussion, the underlying production patterns are largely intact. Nabers had a concussion too. but the season-ending injury was the ACL, and the model now takes the worst injury, not the first one logged.
too optimistic for ACL and Achilles returners. the 0.20 comes from only two historical cases. Aaron Rodgers (2024 return from 2023 Achilles) and Tyler Higbee. Rodgers beat our model projection by 3.5 fp/g. two data points. CV of 1.170. we're being honest: ACL returners are the widest bet we make, and the confidence reflects that.
injury expiry windows
injuries don't linger forever in the model. a soft-tissue injury from two seasons ago shouldn't still be suppressing a projection, and a concussion from last year is clinically different from one three years ago.
we assigned expiry windows by tier:
acl / achilles    2 seasons  (yr1 heavy discount, yr2 partial, yr3+ cleared)
mcl / labrum      2 seasons
hamstring / soft  1 season   (sub-season recovery, single-cycle impact only)
concussion        1 season   (fully resolved by following season in most cases)
once a player clears the expiry window, the recovery factor returns to 1.0 and they're treated the same as any other healthy-season projection. this matters for anyone who was injured in 2023 or earlier and is now fully through their recovery arc.
what confidence actually means here
confidence is not a quality signal. it's a range indicator.
0.40 on James Conner (RB11, 13.0 fp/g) is not us saying he's reliable. it's us saying: the distribution of outcomes for knee returners in year T is narrow enough that if the model says 13.0, you can probably expect something in the low-to-mid 10s. not a tight range. but not a coin flip either.
0.38 on Nabers as a concussion returner would have meant: WR4 is the median, WR2-WR8 as the rough range. but that was the wrong injury. 0.20 on Nabers as an ACL returner means: 9.2 fp/g is the median, and the range is genuinely WR6 to WR30. those are not the same thing. the injury classification matters as much as the recovery factor itself.
0.20 on Jake Bobo (Achilles, WR169, 1.0 fp/g) means: we're guessing. the model produces a number because we need to put something down, but the ACL/Achilles tier has two historical cases and a variance we can't calibrate properly. the 0.20 is the model saying "this is a structured guess, not a projection."
IR players are never more than 0.40 confidence, even in the most predictable tier. the two-season-old feature state is fundamentally noisier than a current late-season snapshot. the confidence cap reflects that.
the A/B validation
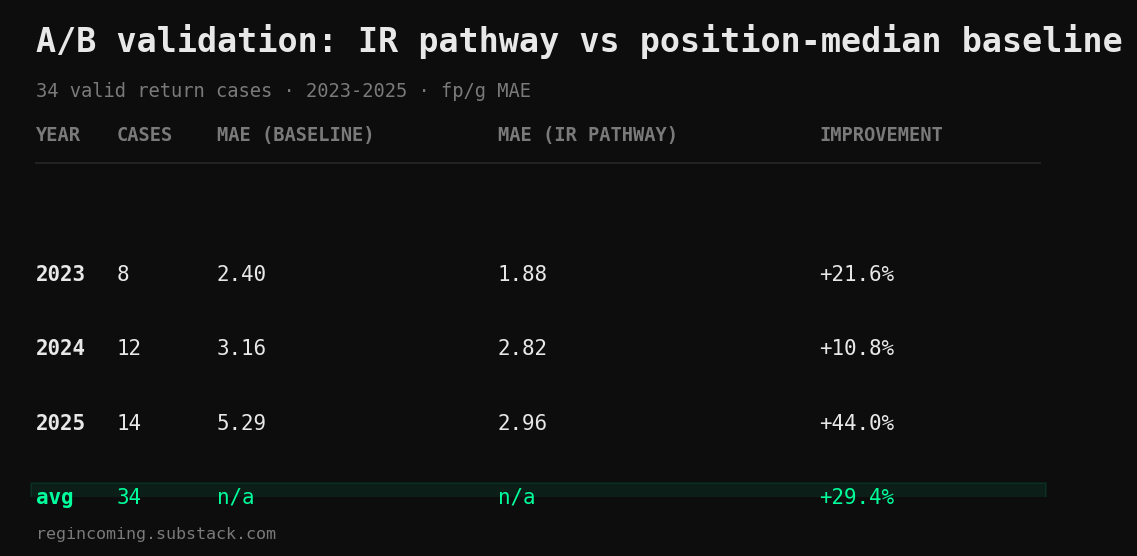
gate was 2% average MAE improvement across all three folds. it passed by 27 points. the pathway reduced average prediction error by 29.4% relative to using the position median as the stand-in for missing players.
that said: the numbers are on population averages. individual cases still blow up. Nick Chubb (2024 projection: 11.4 fp/g, actual: 7.3) came back from his ACL but wasn't the same player. Mike Williams (2024 projection: 10.4 fp/g, actual: 2.6) played three games and was effectively done. AJ Dillon (2025 projection: 8.1 fp/g, actual: 1.0) retired. the confidence cap of 0.40 exists for exactly this reason: IR players are fundamentally less certain than healthy players, even when the pathway beats the baseline by 29 points on average.
we tried to improve it. the model disagreed.
after the initial validation, we ran three additional improvements that had been flagged by external review as high-priority enhancements.
position-specific recovery rates. the argument: RBs coming off ACL injuries recover slower than WRs and TEs due to different tissue demands and scheme trust rebuilding. TEs rarely fully regain pre-injury target share after a catastrophic ligament injury. the proposed fix was a position × injury tier multiplier: RBs off ACL get a deeper discount than WRs off ACL.
we swept three values (0.85x, 0.90x, 0.95x of the base recovery factor). all three were marginally worse than baseline, by 0.08 to 0.34 percentage points. not catastrophically bad. just not additive. the root cause: only 9 RBs total in our 34-case holdout, and maybe one with a Tier 1 (ACL/Achilles) injury. you can't calibrate a position-tier multiplier from a single data point without overfitting.
the infrastructure is built and sitting in the codebase as a feature flag. when the RB ACL sample grows past 4 or 5 cases, we'll test it again. the ideas are structurally correct. the data just isn't there yet.
career injury burden flag. the argument: players with 2 or more distinct major injuries in the prior 3 seasons are "glass" players. flag them, apply an additional 0.93x rf discount, drop confidence by 0.04.
we queried 8 seasons of injury history across all skill positions. only 3 players triggered the flag: Colt McCoy, Jakeem Grant, and Will Dissly. none were fantasy-relevant in our holdout window. the penalty applied to zero cases. identical result to baseline.
the flag is in the code. if the pool of flagged players grows as we add more data, it may matter. right now it's a future-proofing exercise.
duration-based severity upgrade. the argument: soft-tissue injuries (hamstring, ankle, knee) that kept a player Out for 8 or more consecutive weeks should be treated as surgical-severity cases even when the report language doesn't say "surgery." upgrade Tier 3 to Tier 2 severity.
again, zero trigger cases in the holdout. players who miss an entire season are almost universally classified as Tier 1 (ACL/Achilles) or Unknown based on the injury report text. Tier 3 injuries tend to cost a few weeks, not a season. when they do cause a full-season absence, the report text typically doesn't stay "hamstring". it escalates to "knee" or falls into Unknown. no upgrades triggered.
the takeaway from all three: the current model is already at the ceiling of what public injury report data can support at this sample size. the pathway beats the position-median baseline by 29.4% without any of the enhancements. adding complexity on top of that doesn't help when the holdout doesn't have enough of the specific cases the enhancements target.
the 2026 IR players that matter
58 players were added via the injury return pathway. the ones worth knowing:
Malik Nabers -- WR16 / 9.2 fp/g / confidence 0.20
ACL recovery factor 0.75x. had a concussion in week 5 and an ACL in week 9 of 2025. model uses the worst injury. 94 targets in 2024 as a rookie. the ceiling is still WR1 territory, but the ACL uncertainty is real. don't pay WR1 draft capital. don't let him fall past round 4.
James Conner -- RB11 / 13.0 fp/g / confidence 0.40
knee recovery factor 0.99x. tier 3, the most predictable IR class. the model barely discounts him at all. when Conner is healthy he produces. the 0.40 confidence is doing real work: if he goes down again the floor is 0 games, not 13.0 fp/g.
Joe Mixon -- RB20 / 10.8 fp/g / confidence 0.40
ankle. same tier, same story. healthy 2024 baseline runs through the model cleanly. the injury discount is minimal. this is basically a healthy-player projection with an IR stamp.
Sam LaPorta -- TE6 / 8.2 fp/g / confidence 0.40
shoulder recovery factor 0.99x. the model didn't discount him at all. TE top-10 for a player who looked like a top-4 TE before he got hurt. if he's fully healthy, the upside is above this line.
Kyler Murray -- QB16 / 16.8 fp/g / confidence 0.40
foot, 0.92x recovery. projecting near the QB1-QB2 cutoff. 0.40 confidence means treat it as a wide QB2 with upside to QB1. the foot discount is small; the injury history discount is in the confidence band.
Jake Bobo -- WR169 / 1.0 fp/g / confidence 0.15
Achilles, 0.75x. near the bottom of WRs. the 0.15 confidence is below the standard ACL floor of 0.20 because this is a multi-injury concurrent case: the model applies an additional complexity discount. this is the model saying: we have a number, but treat it as trivia.
what's next
the tiered confidence values are derived from 34 valid cases split across 5 tiers. the ACL tier has 2 data points. the MCL/labrum tier has zero cases and is running on a conservative default. as cases accumulate (roughly 12-15 per season), we'll re-calibrate annually and re-run the enhancement tests against whatever new population exists.
in-season, IR confidence scores will update as players return to practice and accumulate live data. once a returning player crosses 4 games of 2026 data, the standard model takes over and the IR stamp comes off.
for now: 58 players are projected, calibrated, and stamped. three proposed improvements tested and rejected by the data. the current model holds.
come fight us in the comments with the IR player you most disagree with. we log every W and L in january.
[📥 Download the full Google Sheet here. [sheet link]]